Church data, made clear

See the story your church data is telling.

Bring attendance, engagement, and ministry metrics into one clear view—then keep your team aligned with dashboards and automated reports.

30 days free · No credit card required · Cancel anytime
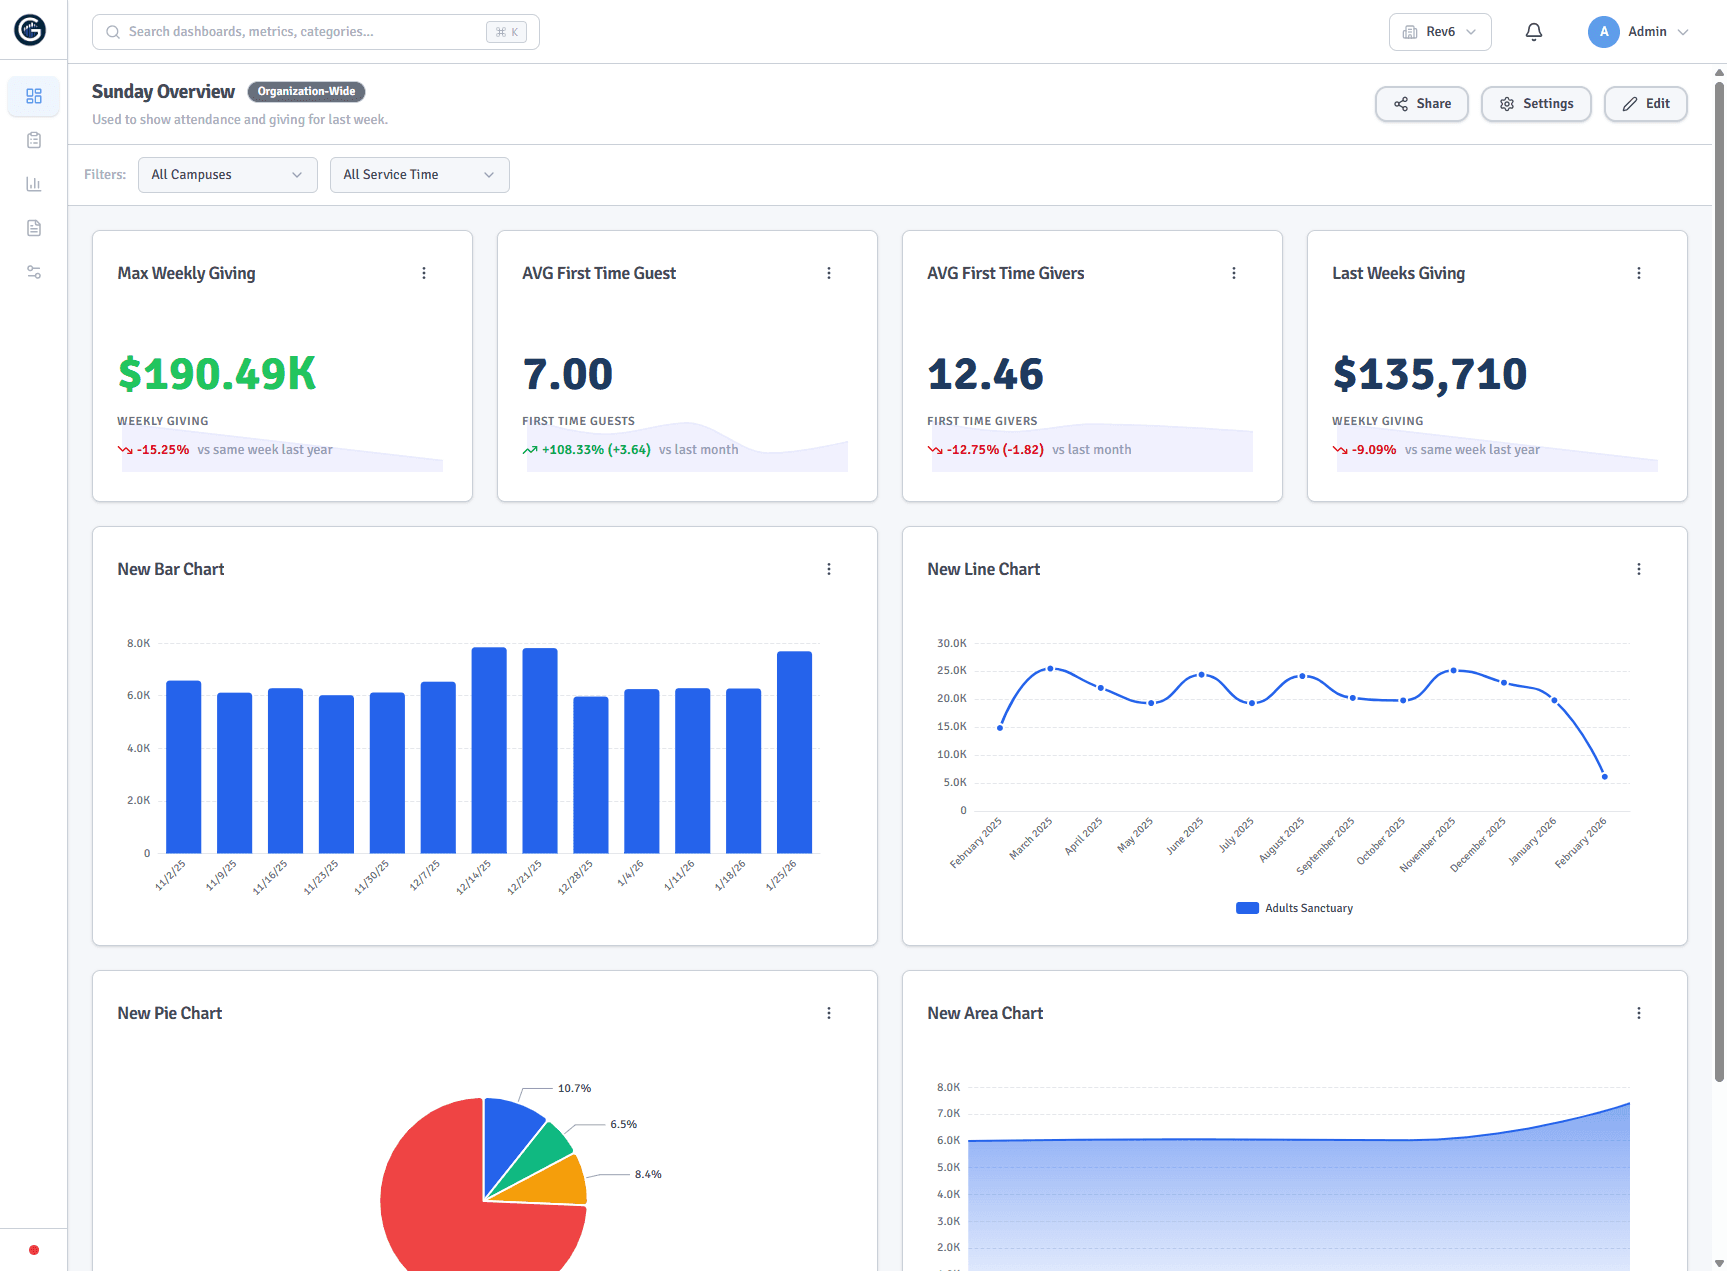
Graphit ministry dashboard showing Sunday attendance and engagement trends
One shared viewFrom weekend numbers to the leadership meeting—without rebuilding the report.
Unlimited usersInvite the whole team
Multi-campus readySee each location clearly
Automated reportsKeep leaders in the loop
Built for churchesNo generic BI learning curve
From scattered to shared

The numbers are already there. The clarity usually isn’t.

Spreadsheets, weekend reports, and disconnected systems make it hard to see what is changing. Graphit gives your team a dependable place to understand the whole picture.

01

Stop rebuilding the same report.

Keep the metrics your leaders rely on in one consistent, reusable view.

02

See change before it becomes a surprise.

Follow trends over time and bring the right questions into the room earlier.

03

Give every leader the same story.

Share dashboards and scheduled reports without adding more meetings or manual work.

Dashboards

A useful view for every conversation.

Build dashboards around the way your church actually leads—from a Sunday overview to campus health, groups, generosity, or next steps.

  • Choose the metrics that matter to each team
  • Compare campuses and time periods
  • Keep sensitive data behind role-based permissions
A customizable Graphit dashboard
Simple input

Make good data easier to collect.

Give ministry teams a focused entry experience that feels approachable, not like a spreadsheet or a business-intelligence tool.
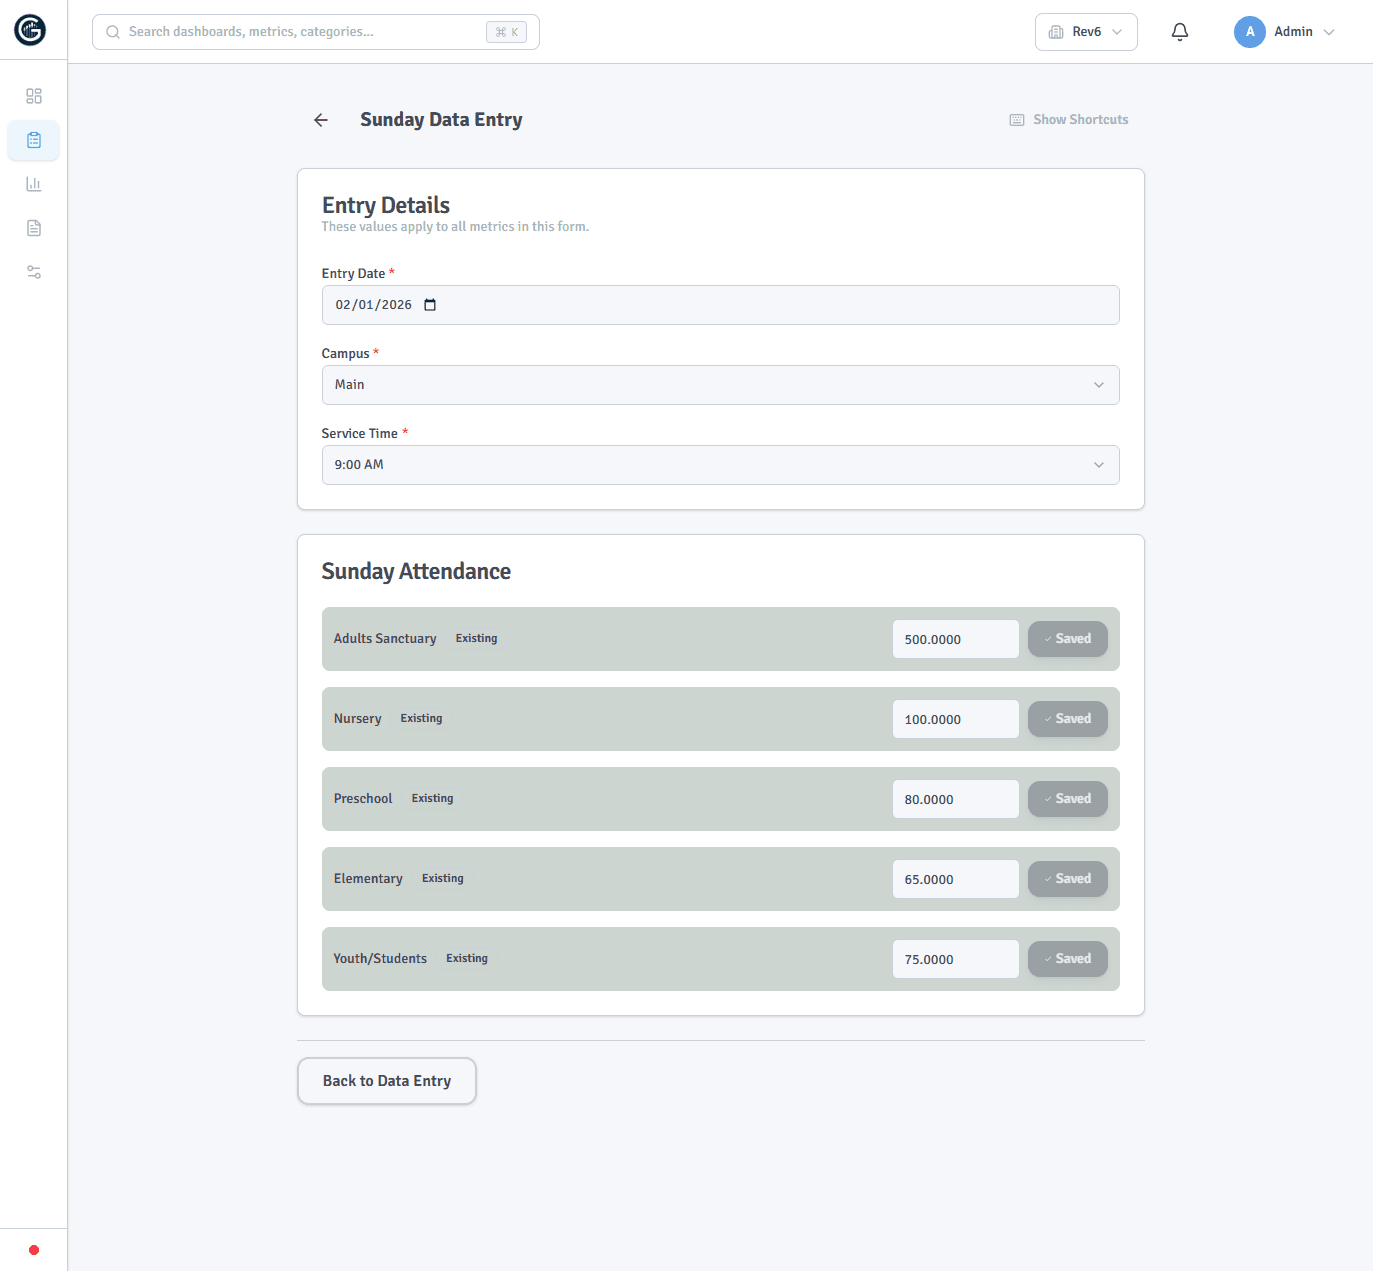
  • Define metrics in language your team already uses
  • Organize entries by campus, date, and ministry area
  • Connect external sources without limiting connections
Graphit metric entry screen
Metrics and reports

Let the insight travel to your team.

Organize a shared metric library, then schedule the reports that keep staff and leadership informed without another recurring task.
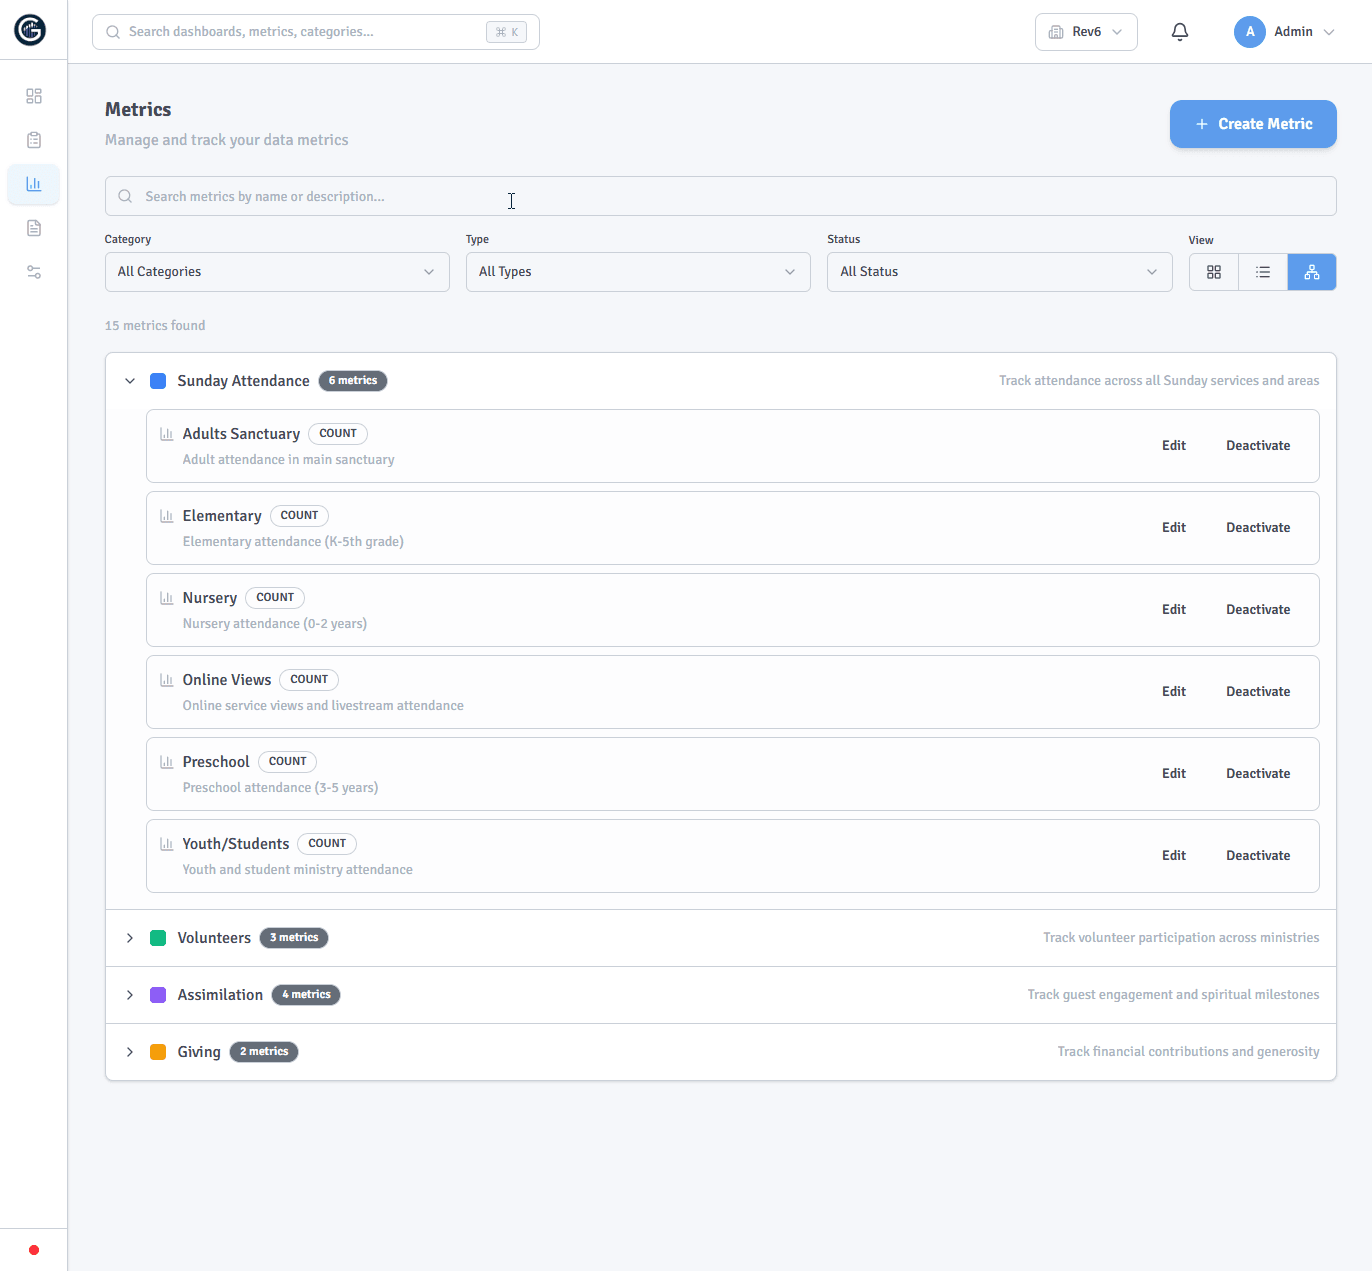
  • Build a consistent source of truth
  • Send reports daily, weekly, or monthly
  • Retain years of history as your church grows
Graphit metrics management screen
How it works

Start with what your team already knows.

Graphit is designed for steady adoption—not a months-long analytics project.

1

Connect or enter

Bring in source data or begin with the metrics your team already collects.

2

Shape the view

Build dashboards for the decisions, teams, and ministry rhythms that matter.

3

Keep it moving

Schedule reports so the right insight reaches the right people on time.

Straightforward pricing

Every plan gets the whole product.

Plans scale with your church—not by holding features back. Upgrade when you need more campuses, dashboards, metrics, or reporting capacity.

Essentials

For single-campus churches getting started

$49 / month

$539/year · 1 month free

  • 1 campus
  • Unlimited users
  • Unlimited data source connections
  • 10 dashboards · 25 metrics
  • 1,000 data entries / month
  • 5 years of data history
  • 3 automated email reports
Start free trial
Most popular

Growth

For growing churches and early multi-campus

$99 / month

$1,089/year · 1 month free

  • Up to 3 campuses
  • Unlimited users
  • Unlimited data source connections
  • 25 dashboards · 100 metrics
  • 10,000 data entries / month
  • 7 years of data history
  • 15 automated email reports
Start free trial

Advanced

For large and complex organizations

$249 / month

$2,739/year · 1 month free

  • Unlimited campuses
  • Unlimited users
  • Unlimited data source connections
  • Unlimited dashboards & metrics
  • Unlimited data entries
  • 10 years of data history
  • Unlimited automated email reports
Start free trial

All plans include unlimited users and unlimited data source connections.

Start with one clear view

Make the next leadership conversation clearer.

Try Graphit for 30 days. Bring your data, invite your team, and see what becomes visible.